Analyze Cache Hit Performance
When an asset is served from the Edgemesh® cache in the browser, a Server Timing header is appended to allow you to inspect the cache status. In addition, the X-Edgemesh-Client header provides an easy way to inspect each response. Beyond these two methods, Edgemesh® Client includes a function to get the aggregated statistics for the page load, called edgemesh.getStats(). Calling this method will return an object that details how many resources were required to render the page, how many were served from the Edgemesh® cache, how many were served from the origin server, and the percentage of assets that were served from cache (percentAccelerated). For the Google Analytics integration, the percentAccelerated result is used as the value in the non-interaction event.
When assets are served from the Edgemesh® cache in the browser, you have various methods available to inspect the cache status and gather relevant statistics. These tools provide valuable insights into the performance and effectiveness of Edgemesh® Client in accelerating your website.
Server-Timing Header
When an asset is served from the Edgemesh® cache, a Server-Timing header is appended to the response. This header allows you to inspect the cache status from the timing panel in the network panel of developer tools and via the PerformanceResourceTiming entries. By analyzing this information, you can gain a deeper understanding of the caching behavior and identify potential optimization opportunities.
X-Edgemesh-Client Header
In addition to the Server-Timing header, Edgemesh® Client adds the X-Edgemesh-Client header to each response. This header provides a convenient way to inspect the response and determine whether it was served from the origin server (origin), cached by Edgemesh® Client (cached), or prefetched and cached by the Edgemesh® Client (precached). This information can help you validate the effectiveness of the cache and troubleshoot any caching-related issues.
Get Stats Method
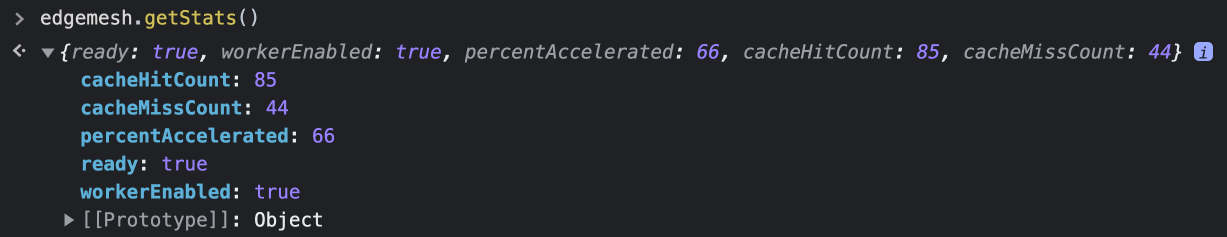
To obtain aggregated cache statistics for the page load, Edgemesh® Client includes the edgemesh.getStats() method. By calling this method, you will receive an object that provides detailed information about the resources required to render the page. This includes the number of resources served from the Edgemesh® cache, the number of resources served from the origin server, and the percentage of assets served from the cache (percentAccelerated).
The percentAccelerated value is particularly useful for the Google Analytics integration. It can be used as the non-interaction event value, allowing you to track and analyze the percentage of assets served from the cache. This information gives you insights into the overall acceleration performance of your website.
By leveraging these cache statistics and analytics, you can monitor the effectiveness of Edgemesh® Client, identify areas for optimization, and make informed decisions to improve your website's performance.